Ask in plain English
Type a question the way you'd ask a colleague and get an instant chart, table, or summary — no query language required.

Self-service, scope-aware analytics over your workforce data warehouse. Managers ask in plain English and get governed charts, custom reports, and exports — never more than they're allowed to see.
No SQL, no ticket queue, no waiting on a report. Ask, refine, and export — all within the boundaries each user is allowed to see.
Type a question the way you'd ask a colleague and get an instant chart, table, or summary — no query language required.
A self-service report builder lets you assemble exactly the columns, filters, and groupings you need — without writing a line of SQL.
Send any answer or report to a polished Excel workbook or PDF in a click — formatted, scoped, and ready to share.
Have the metrics that matter delivered on a schedule — daily overtime, weekly labor cost, monthly turnover — straight to the right inboxes.
Role-tuned Insights Dashboards put the right KPIs in front of operations, HR, finance, and executives — with each viewer's slice enforced at the row level.
Start at the company level and drill into department, team, or individual employee — following the question wherever it leads.
Built on Perigee Cloud — the secure platform carrying the workforce data backbone CTR/NY has perfected since 1945. Ask a question, watch the chart appear, then refine, export, or schedule it — all in one place.
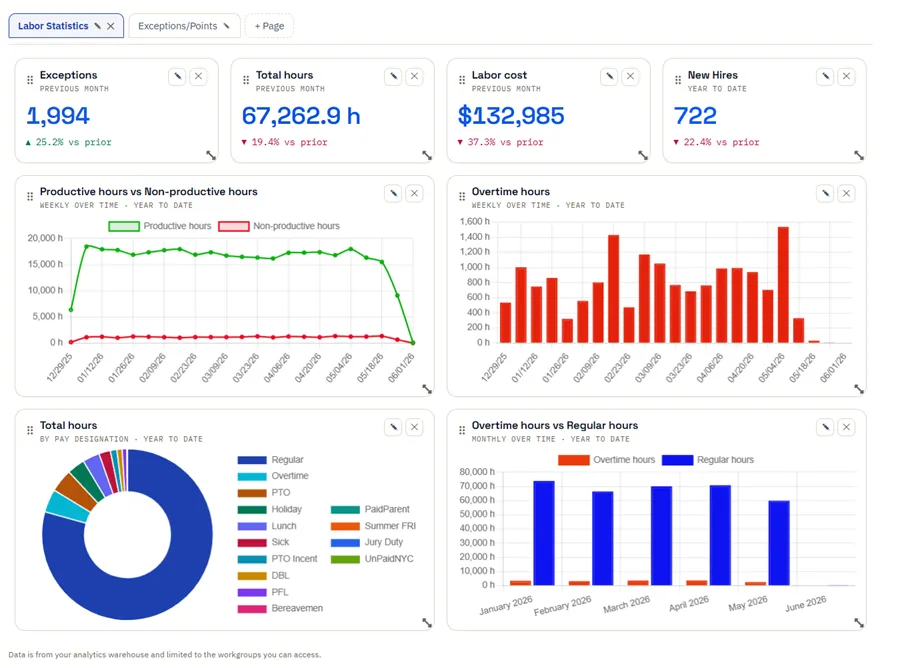
Scope isn't a setting you remember to switch on. It's enforced at the row level on every question, every report, and every export — so the platform can be open to managers without ever exposing data they shouldn't see.
The questions differ by role. The governance, the exports, and the plain-English interface stay exactly the same.
Track overtime, coverage, and exceptions across departments. Catch labor cost creep before it shows up in payroll, and act on it the same day.
Monitor turnover, attendance trends, and headcount by team. Build the people-data reports you need without waiting on a custom build.
Reconcile labor cost to the hour, compare planned versus actual, and export period-ready workbooks for close — all reconciled to source.
A clean, role-tuned dashboard of the metrics that move the business — trends, costs, and outliers — without digging through raw data.
The CTR/NY Analytics Platform is self-service, scope-aware analytics over your workforce data warehouse. Instead of running reports or waiting on an IT ticket, managers ask a question in plain English and get an instant chart, table, or summary, then refine, export, or schedule it. Every result is governed, so no one ever sees more than they're allowed to see. No SQL required.
With the CTR/NY Analytics Platform you can ask questions in plain English and get instant charts and tables, build custom reports with a self-service report builder and no SQL, export any answer to Excel or PDF in one click, schedule insights like daily overtime or weekly labor cost to the right inboxes, view role-tuned Insights Dashboards, and drill from company level down to individual employees.
The CTR/NY Analytics Platform is one platform tuned to how each team thinks. Operations tracks overtime, coverage, and exceptions. HR monitors turnover, attendance trends, and headcount. Finance and Payroll reconcile labor cost to the hour and export period-ready workbooks for close. Executives get a role-tuned dashboard of trends, costs, and outliers. The questions differ; the governance and plain-English interface stay the same.
Scope isn't a setting you remember to switch on. The Analytics Platform enforces row-level scope per user and per role on every question, report, and export, so users only see their own workgroups, teams, and locations. Every query and export is auditable, and your data stays yours, isolated and under your control. It's built on Perigee Cloud, CTR/NY's secure workforce data platform.
Book a live walkthrough with CTR/NY. You'll see the Analytics Platform answer natural-language questions, build custom reports, export to Excel and PDF, and enforce governed scope, all tailored to your workforce so you can see your own data answer your own questions. Email sales@ctrny.com or call 1.800.777.5226 to request a demo.
Book a live walkthrough of the Analytics Platform — natural-language questions, custom reports, exports, and governed scope — tailored to your workforce.